This project is an exploration of how much privacy Strava's "privacy zones" actually provide - and how much they quietly give away.
Across a series of experiments, I examined the uncomfortable question: Given only what Strava exposes publicly, how precisely can someone infer a user's true starting location from their activities?
To answer that, I built synthetic activity datasets, uploaded them through Strava's normal ingestion pipeline and analysed the resulting public GPX files using a mix of geometric methods, machine learning and explicit modelling of the underlying road network.
This page is the hub for the full investigation. It links to all posts in the series, the interactive dashboard and the code, including the datasets. If you're curious how private Strava's privacy zones really are - or are concerned how close someone could get to finding out where you live from Strava - this is where the entire investigation lives.
Spoiler: they reveal more than you might think, one of my methods got to within a metre, yes centimetres, in one experiment.
The Setup
To figure out whether someone could locate a user's true start location from their activities, I needed two things:
- Lots of activities - all starting from the same location.
- The same activities - with Strava privacy zones applied.
Once I had both datasets, I could compare them and see how close I could get to the hidden start using different methods.
Generating The Activities
First, I needed realistic sample activities. I wrote a route generator that pulls in the street network using OSMnx and models it with NetworkX: it then generates routes from the same start location that wander outwards through a series of semi-randomised waypoints pointing roughly in the same direction (±60° variation and ±30% distance variation).
This isn't meant to be perfect. Real human activities aren't perfect either, especially in dense cities with patchy GPS and awkward street geometry. The focus was on variation.
I chose London as the test area for two reasons:
- Over 80% of the UK population lives in urban areas.
- Strava's own UK heatmap shows massive concentrations of activity in cities, in particular London.
40 activities later, I had a solid dataset: varied, messy and close enough to real-world activities to reveal real patterns.
Applying Strava's Privacy Zones
This part was less elegant.
Strava doesn't expose an official "apply privacy zone" function, everything happens on upload. So I uploaded each activity to a fresh Strava account using their upload API, waited for Strava to process it (rate limits make this a surprisingly patient exercise), and then downloaded the GPX versions from a separate, unconnected account.
Those downloaded activities include Strava's default privacy zone, exactly what a stranger would see.
The result was a clean before/after dataset*:
- Original activities with true starting points.
- Privacy-filtered versions with hidden starts.
* The dataset, along with several others and my analysis scripts is available in the GitHub repository.
Visually, even just eyeballing the map of activities, I could already see that the "hidden" location wasn't that hidden.
Reverse-engineering: The Methods
Once I had the before/after datasets, the big question was simple: If someone wanted to estimate the true starting point, how close could they get?
I tried six different approaches: from the quick and easy to far more sophisticated methods using clustering, heatmaps and route mapping on the underlying road network.
The simplest method? Just average all the start points.
It worked. Really well. Predicting the start to be 29.9m from the true start location. In a dense city centre, that narrows the possible start location down to within a few houses on a typical street.
Here's the view looking out from the true start location to the start location predicted by the simple average method:
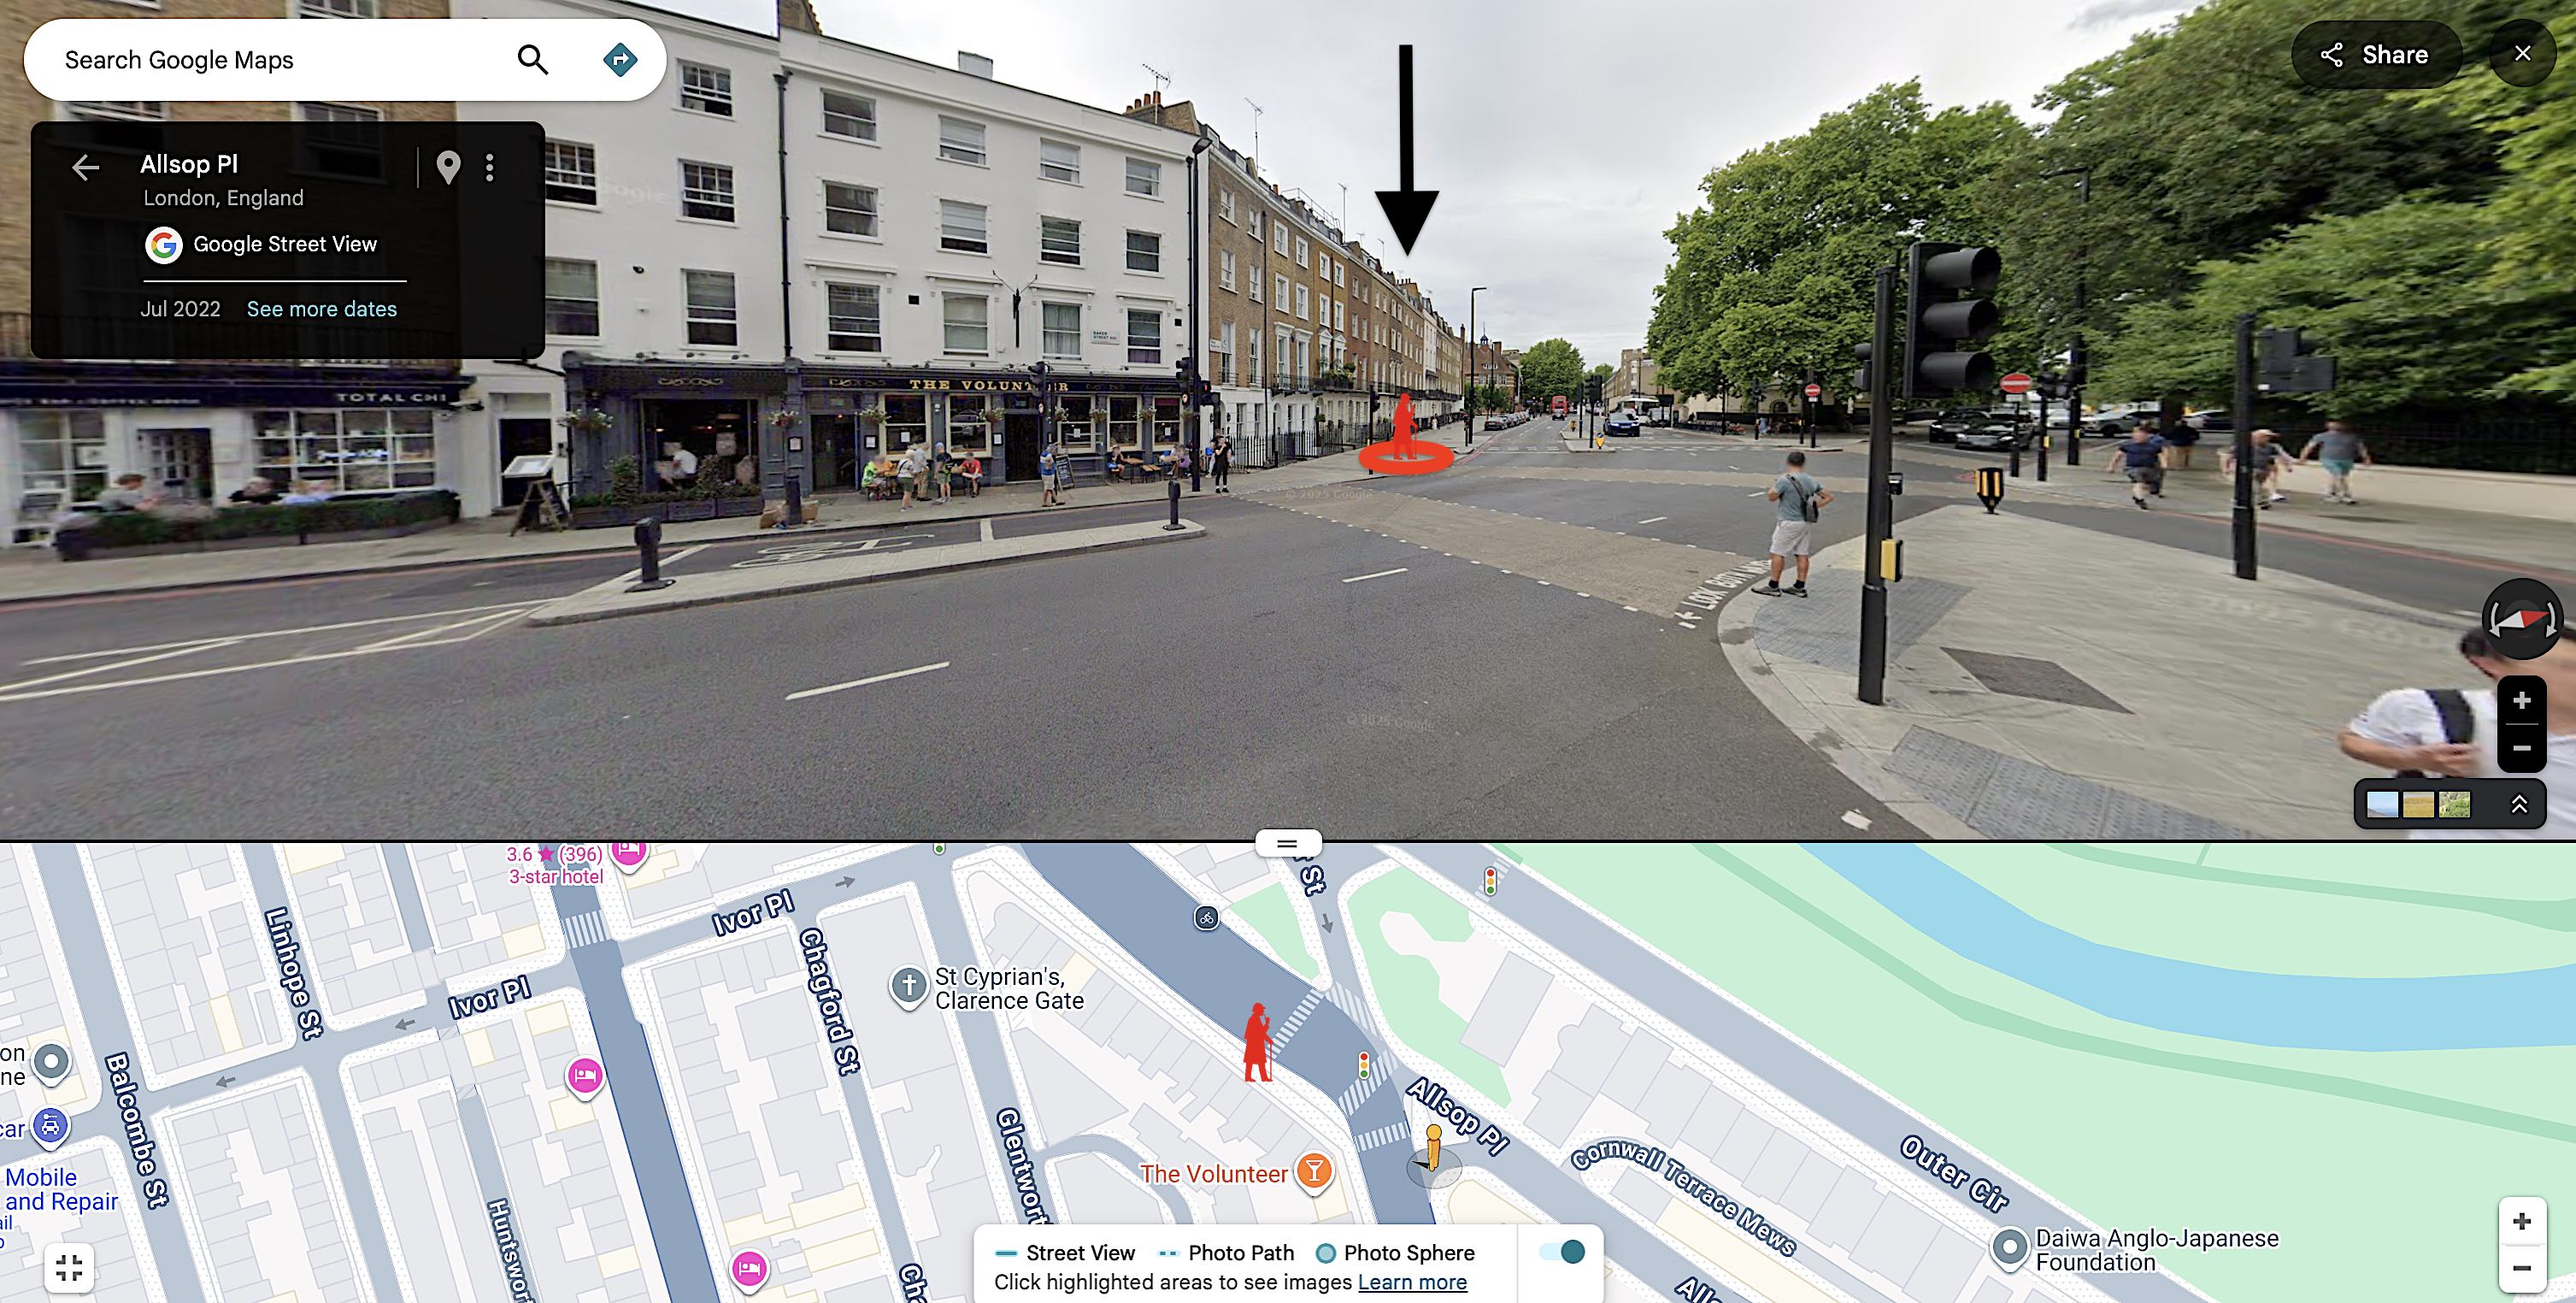
Not very far at all, considering all the visible activity starts are 200m away!
I also tried the following more sophisticated approaches:
- Boundary method (37.4m) - drawing a polygon around the start points and then finding the centre.
- Circle fit method (33.9m) - finding the circle that best fits the start points and then taking the centre.
- Donut overlap method (28.5m) - drawing rings around each start point and finding the region where they overlap most.
- Adaptive donuts method (31.0m) - drawing rings that vary in size around each start point, depending on the reported activity distance on Strava, and finding the region where they overlap most.
- Homing method (18.5m) - searching a grid of candidate "start" locations, plotting activities from each candidate to each start location, minimising the overall error and zooming in on the best candidate.
This is striking - from all those different public start locations 200m away, it's possible to get this close to the true start location. This is quite scary.
Where Things Escalated
I expected this to be a quick investigation, but things didn't quite work out that way and I just kept finding new questions to answer.
After that first experiment, I just had to answer:
What if you only had 10 activities instead of 40? (Turns out, it barely matters if they're well-distributed).
What if you used a larger privacy zone? (400m? 800m? Surely that helps? It does, but in some cases not as much as you'd hope).
What if you don't live in a city? (Rural locations, cul-de-sacs, villages - each environment tells a different story).
We must be able to get even closer, right? (The homing method uses the road network and Strava metadata to get even closer).
Each question led to another experiment, which led to more alarming results, and ultimately another post. It wasn't meant to be this way, but one post would never have done it justice. What started as curiosity turned into a larger investigation consisting of 5 reasonably technical posts.
What I Built
Along the way, I built an interactive dashboard where you can explore all the results yourself. Switch between locations, try different methods and see the results - so you can see for yourself how easily the hidden start point can be predicted in some cases.
I also open-sourced the codebase so others can access the data, reproduce the experiments and run their own analysis*.
* The codebase does not include the homing method, since I think it's too effective. Please use responsibly and in line with the ethical guidelines of the project.
The Takeaway
Strava's privacy zones do a great job at protecting your privacy on a single activity, but when you've uploaded a few activities they don't do nearly as much as most people probably think.
In most locations tested, someone could plausibly figure out where you live, almost down to the house. From this it wouldn't be a stretch to get the exact house in the real world. Not exactly private.
This isn't meant to be alarmist. Strava does take privacy seriously and privacy zones do help protect your privacy - many providers don't offer much on this (and we're all much better with them). But it's worth understanding the limitations.
Why This Matters
There are documented cases of thieves using Strava data to target bikes and homes. If privacy zones turn out to be weaker than people assume, it's better to know than to assume everything is fine.
This research isn't about exposing a vulnerability for malicious purposes - it's about understanding what's actually happening when you upload an activity to Strava. The more people understand these systems, the better we can protect ourselves and each other.
And honestly? It was just a nice technical puzzle. Once I realized it might be possible to "unmask" a true starting location, I had to solve it.
The results surprised me a lot. They might surprise you too.